The green peafowl (Pavo muticus) is known as the "King of Birds" and is of great significance to the cultural inheritance of East Asia and Southeast Asia. With historically wide but now scattered distributions (Figure 1), major drivers underlying its endangerment still remain unclear.
A research team led by Kunming Institute of Zoology of Chinese Academy of Sciences in collaboration with Sun Yat-sen University and Academia Sinica has unraveled the relative role of historical climate change and human activities in the green peafowl’ population declination through comparative analyses on genomic, climatic and anthropogenic data. The findings were recently published on Proceedings of the Royal Society B: Biological Sciences.
With the first de novo genome and comprehensive population genomes, the researchers found that the effective population size (Ne) of the green peafowl declined sharply from the Mid-Holocene (~6000 years ago) to 100 years ago, with a magnitude over 200 folds. Further comparison of historical and modern samples showed continuous genetic-diversity decline over the past 50 years (Figure 2).
Nevertheless, the researchers revealed insignificant impact of Holocene climate change on the distribution of the green peafowl (Figure 3), while negative association between its Nes and the integrity of historical human activities (Figure 4). Based on these results, the researchers concluded that human disturbance since prehistoric times might have been the main driving factor for the endangerment of this elegant pheasant.
The researchers also found a high inbreeding level in the existing populations of the green peafowl, and call for a priority to enhance habitat protection and to construct ecological corridors to maintain its evolutionary potential in response to future environmental changes.
The research was supported by the Chinese Academy of Sciences (XDA23080500) and the National Natural Science Foundation of China (31872255 and 31772437).
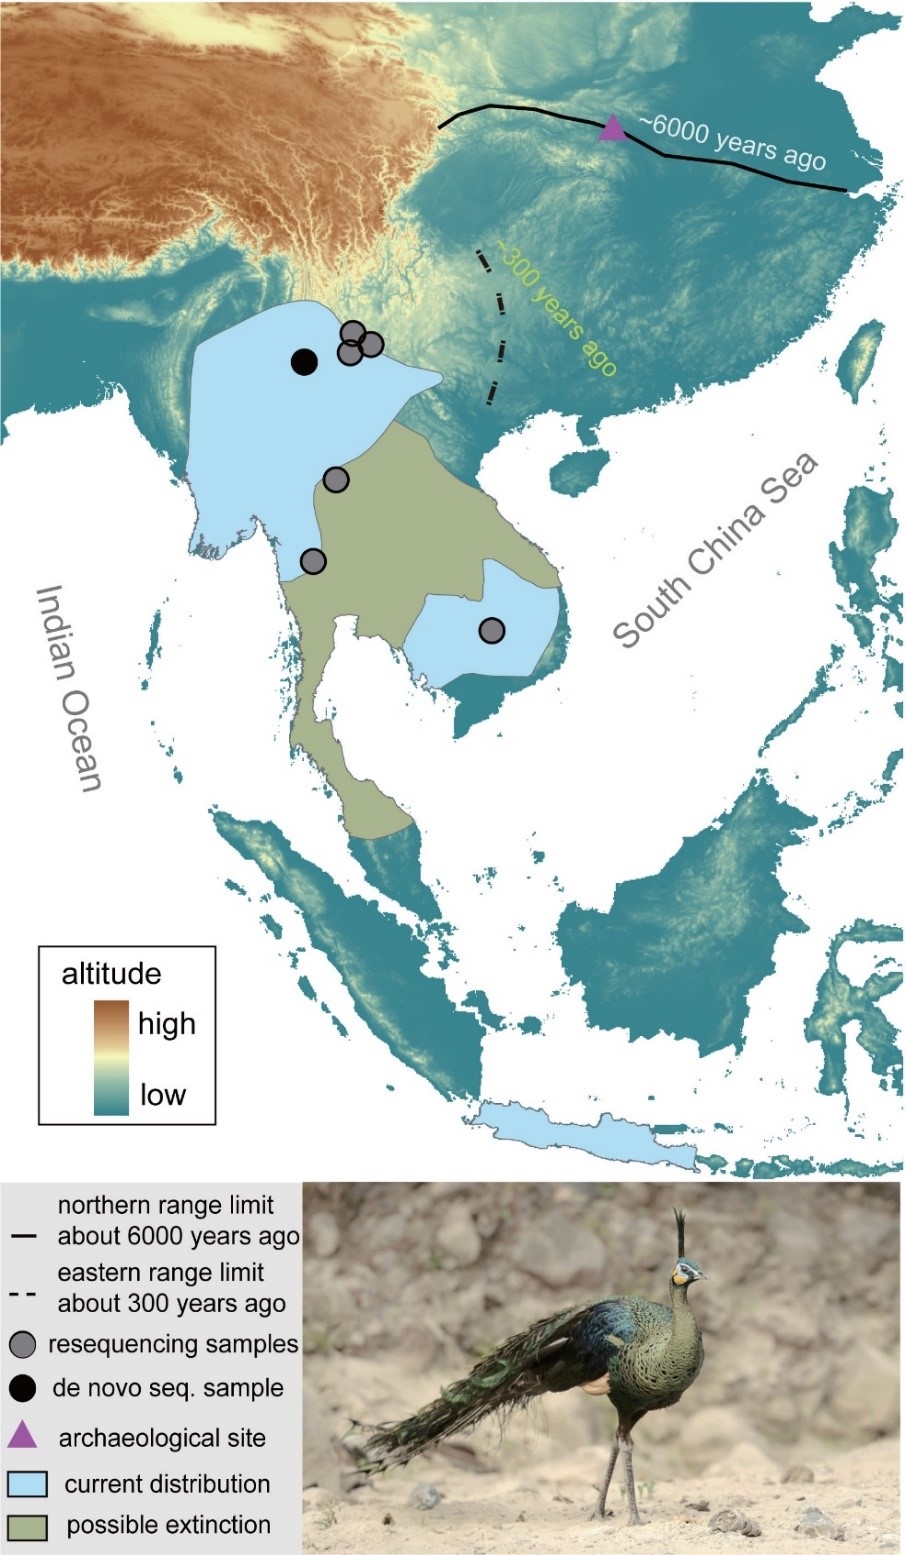
Figure 1. Sampling localities and distribution of the green peafowl. Closed curves indicate distribution ranges obtained from BirdLife International (2018), with a green peafowl’s photograph by ZHUANG Xiaosong.
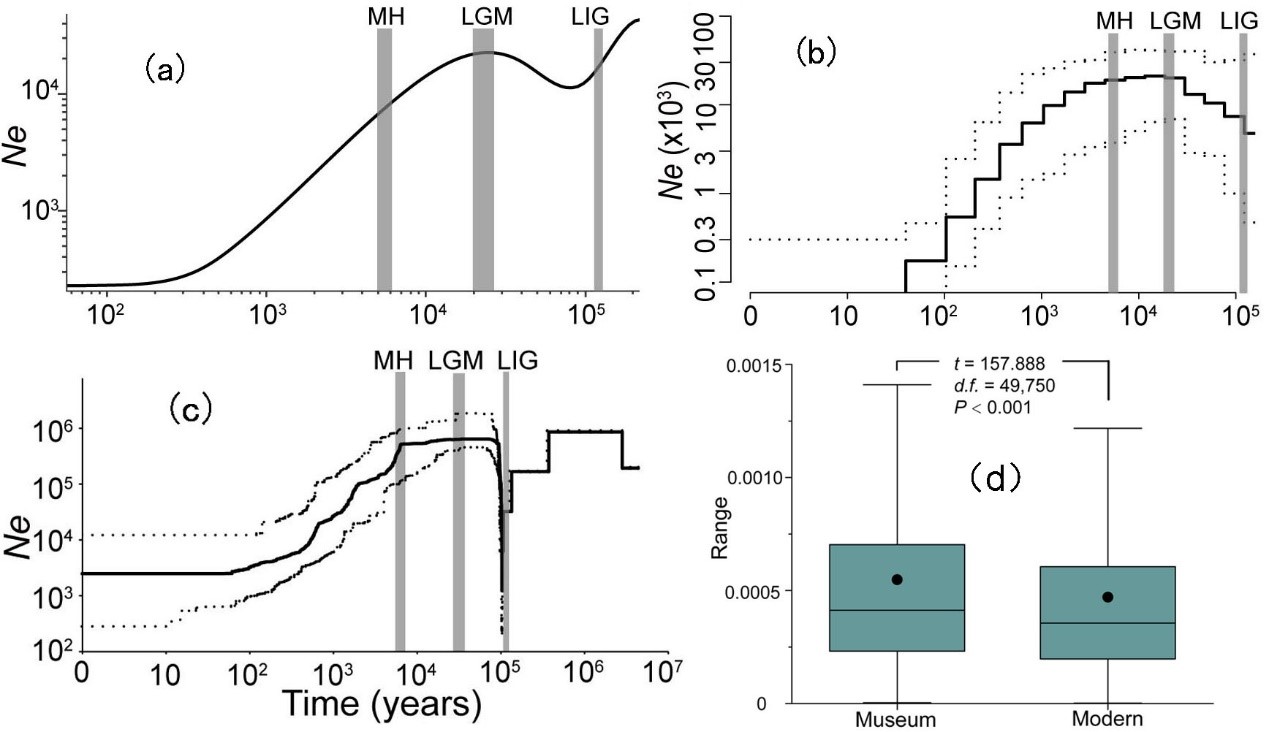
Figure 2. Reconstructions of population size histories for the green peafowl. Population genomic estimates from (a) SMC++, (b) PopSizeABC and (c) Stairway Plot based on 22 unrelated genomes across the last interglacial period (LIG, approx. 132–112 Ka), the last glacial maximum (LGM, approx. 26–19 Ka), the mid-Holocene (MH, 7–5 thousand years ago (Ka)) and the present day. (d) Comparison of genetic diversities between museum and modern samples. Statistically significant differences between both sets of values were determined by paired-sample t-tests with a significance level of 0.05
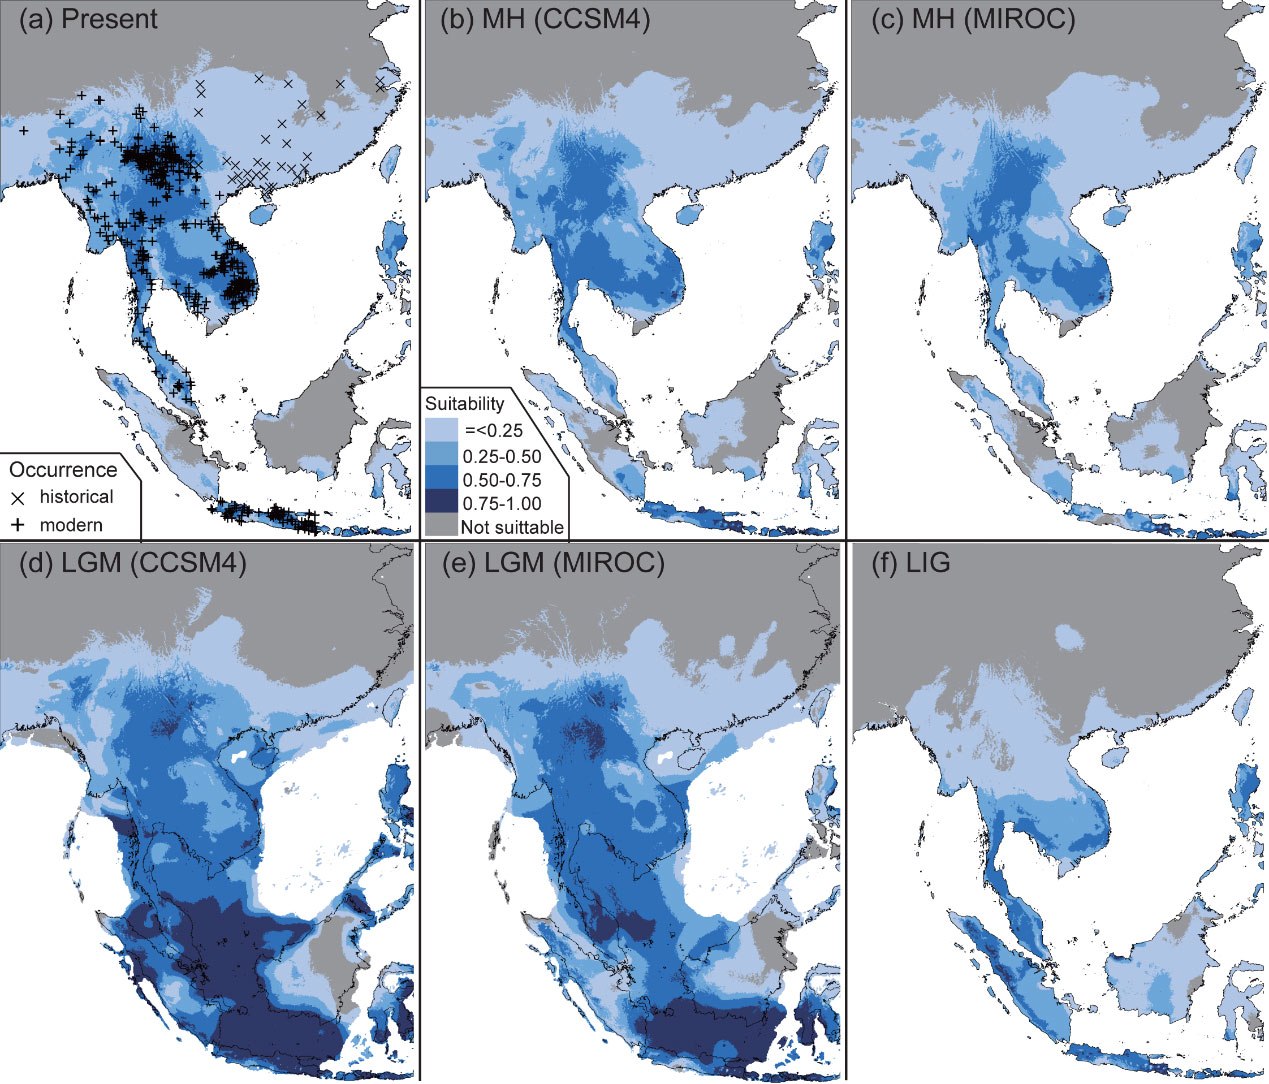
Figure 3. Ecological niche models and distribution dynamics of the green peafowl. Four time points were considered, i.e. (a) the present day, (b) and (c) the mid-Holocene (MH; approx. 7–5 thousand years ago (Ka)), (d ) and (e) the last glacial maximum (LGM; approx. 26–19 Ka), and ( f ) the last interglacial period (LIG; approx. 132–112 Ka). For MH and LGM, both general circulation models of CCSM4 and MIROC are considered. Areas with suitability possibilities lower than the minimum training presence logistic threshold (e.g. 0.0308) are considered unsuitable.
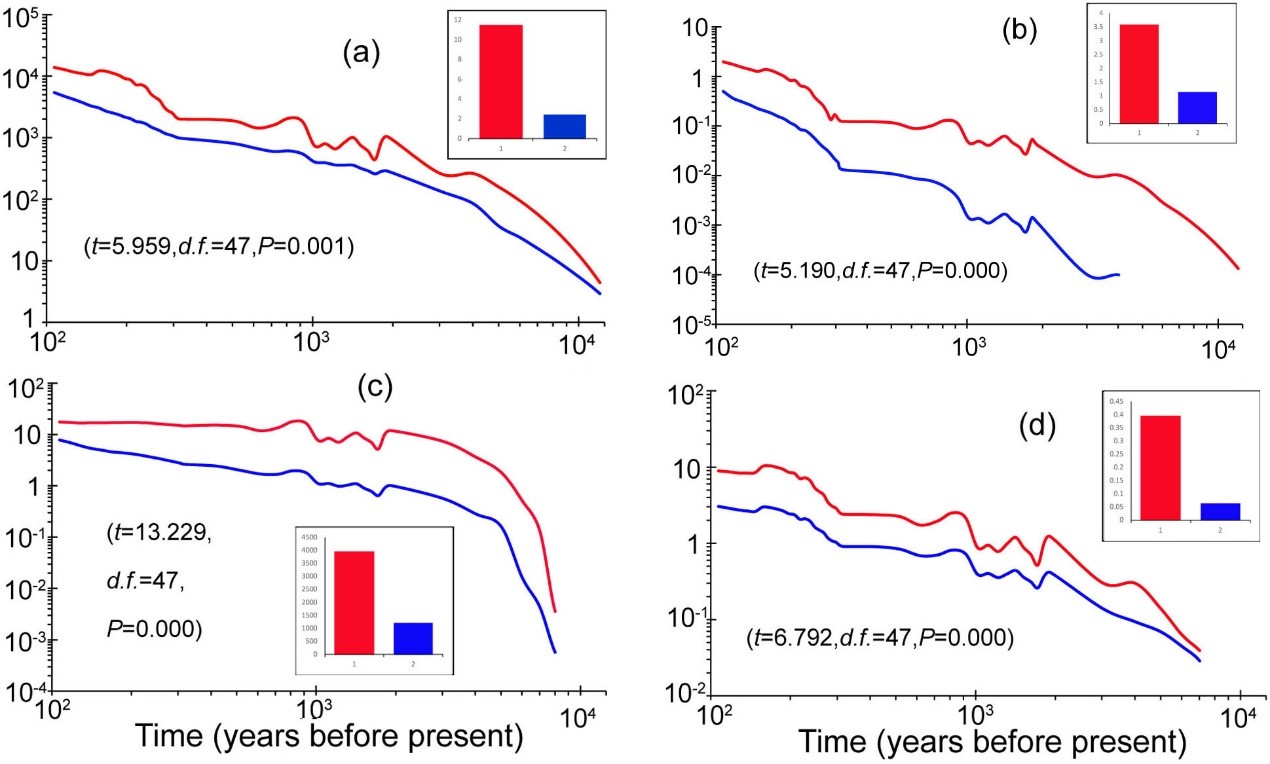
Figure 4. Comparison of human disturbance intensities between historically extirpated regions (the red) and currently survival ones (the blue) of the green peafowl (Pavo muticus). The human disturbance indices include (a) population counts per grid cell, (b) total built-up area in km2 per grid cell, (c) total cropland area in km2 per grid cell, (d) total land used for grazing in km2 per grid cell. The significance was determined by paired-sample T-tests. The insets indicate histograms of average values of these categories across various 48 timepoints (see details in the text).
(By DONG Feng, Editor: YANG Yingrun)
Contact:
DONG Feng
dongfeng@mail.kiz.ac.cn